( ICP true transient simulation at the ignition - case 2 )
ICP 放電開始時の非定常解析は,計算領域の grid もある程度細かくする必要があることが分かりました.そこで,先のモデルよりも小さなモデルで再検討を行い,妥当と思われる結果が得られましたので,以下にご紹介します.
☆
始めに,計算モデルの概略を Fig. 1 に示します.
ガスは,Ar が上部から流入し,サセプターの周囲から排気されると仮定しています.RF電力は,2ターンのコイルによって供給されます(周波数:13.56MHz).なお,サセプター上の電子密度の均一性が良くなるように,コイルの配置を以前のものから変更しています.
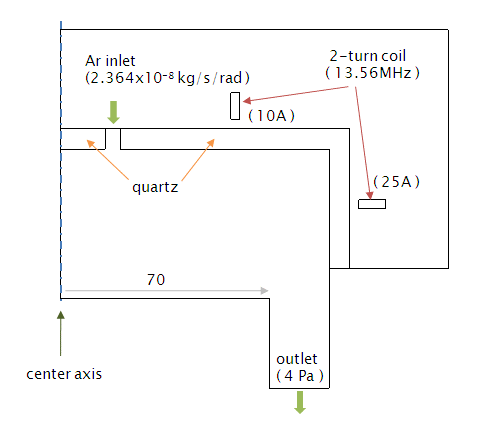
Fig. 1 計算モデル(二次元軸対称)
☆
非定常計算結果を示す前に,このモデルを使って計算した定常計算の結果を幾つか示します.
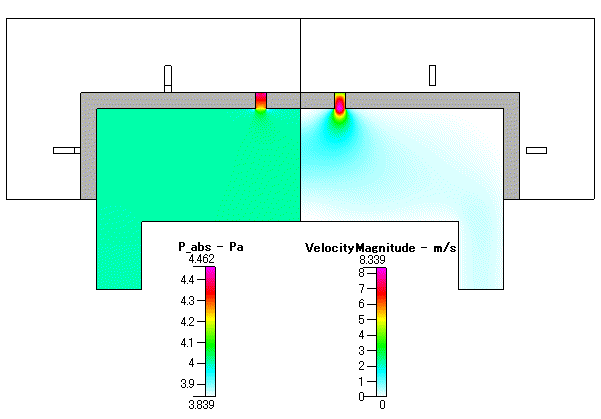
Fig. 2 圧力分布( absolute pressure )及び 流速分布( velocity mangnitude )
流れの速い領域は,ガスの流入部付近のみとなっており,最大でも 10m/s 以下となっています.
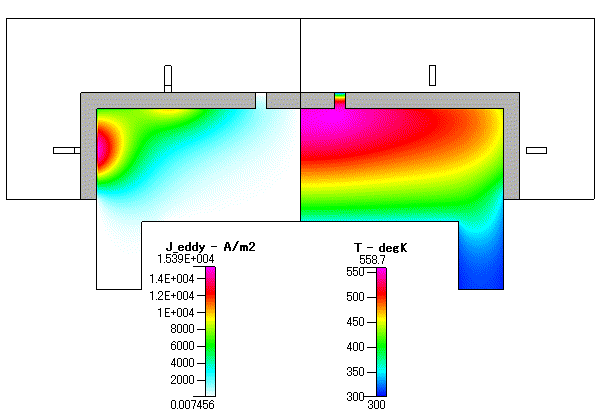
Fig. 3 渦電流 ( eddy current : Jeddy ) 及び 温度( gas temperature )
低圧の計算なので,壁では slip を考慮しています.そのため,境界条件として 300K を設定している壁近傍でも,壁の設定温度よりやや高い温度となっています.
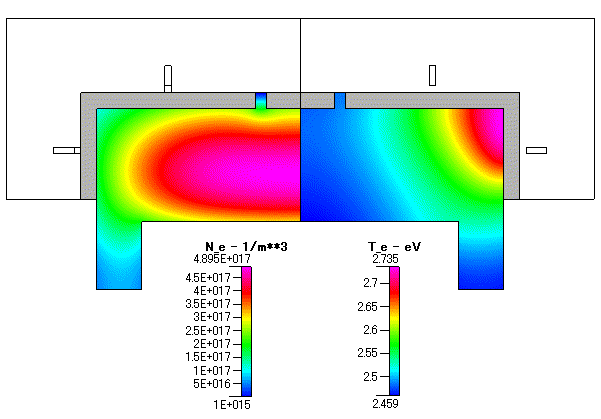
Fig. 4 電子密度( Ne )及び 電子温度 ( Te )
コイルをチャンバーの中央から遠ざけていますが,Ne の最大値は,損失が最も少ないプラズマの中央に位置しています.
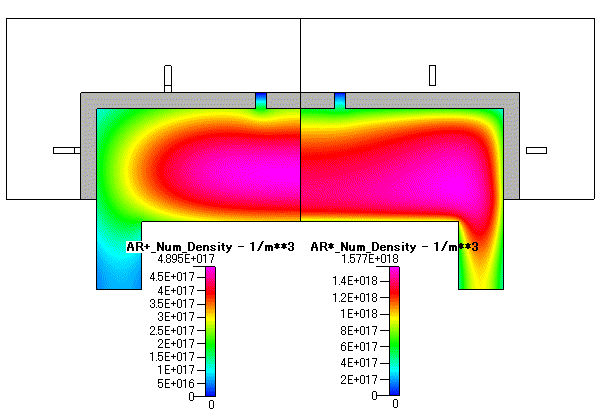
Fig. 5 Ar+ の数密度( AR+ number density ) 及び Ar* の数密度( Ar* number density )
本プラズマシミュレーションでは,両極性拡散を仮定した計算手法を用いているため,電子密度の分布と Ar イオン密度の分布は同じ分布となります.
☆
以下に,非定常計算による条件・結果を示します.time step は1周期を20分割した値(〜1.84e-9s)としました.
計算開始から 1000 [= 50 cycles],10000 [= 500 cycles],12000 [= 600 cycles],14000 [= 700 cycles],16000 [= 800 cycles],18000 [= 900 cycles],20000 [= 1000 cycles],25000 [= 1250 cycles],30000 [= 1500 cycles],40000 [= 2000 cycles],100000 [= 5000 cycles],及び 200000 [= 10000 cycles]steps の Ne と Te の結果を示します.
![transient : Ne and Te ( after 50 cycles ]](2d_2coils_10A_25A_Ne_Te_001000.gif)
Fig. 6 電子密度( Ne )及び 電子温度 ( Te ) [ 50周期後 ]
Ne のピーク値はまだ小さく,まだ,Te は比較的高い値に留まっています.
![transient : Ne and Te ( after 500 cycles ]](2d_2coils_10A_25A_Ne_Te_010000.gif)
Ne の値は急速に大きくなっていますが,Te の値は以前高いままとなっています.Ne のピークは,まだコイルに近いところに留まっています.
Fig. 7 電子密度( Ne )及び 電子温度 ( Te ) [ 500周期後 ]
![transient : Ne and Te ( after 600 cycles ]](2d_2coils_10A_25A_Ne_Te_012000.gif)
Ne の値は更に大きくなり,その一方でTe の値は下がっています.Ne のピークは移動しつつあり,ドーナツ状のプラズマの直径が狭くなって行きます.
Fig. 8 電子密度( Ne )及び 電子温度 ( Te ) [ 600周期後 ]
![transient : Ne and Te ( after 700 cycles ]](2d_2coils_10A_25A_Ne_Te_014000.gif)
Fig. 9 電子密度( Ne )及び 電子温度 ( Te ) [ 700周期後 ]
ドーナツ状のプラズマは,その直径を更に小さくしてゆきます.Te の分布は,大きく変化しなくなっています.
![transient : Ne and Te ( after 800 cycles ]](2d_2coils_10A_25A_Ne_Te_016000.gif)
Fig. 10 電子密度( Ne )及び 電子温度 ( Te ) [ 800周期後 ]
Ne のピーク値はまだ少しずつ大きくなっていますが,密度の高い部分は徐々に装置中央へと移っています.
![transient : Ne and Te ( after 900 cycles ]](2d_2coils_10A_25A_Ne_Te_018000.gif)
Fig. 11 電子密度( Ne )及び 電子温度 ( Te ) [ 900周期後 ]
![transient : Ne and Te ( after 1000 cycles ]](2d_2coils_10A_25A_Ne_Te_020000.gif)
Fig. 12 電子密度( Ne )及び 電子温度 ( Te ) [ 1000周期後 ]
![transient : Ne and Te ( after 1250 cycles ]](2d_2coils_10A_25A_Ne_Te_025000.gif)
Fig. 13 電子密度( Ne )及び 電子温度 ( Te ) [ 1250周期後 ]
![transient : Ne and Te ( after 1500 cycles ]](2d_2coils_10A_25A_Ne_Te_030000.gif)
Ne の分布は円盤状になっています.
Fig. 14 電子密度( Ne )及び 電子温度 ( Te ) [ 1500周期後 ]
![transient : Ne and Te ( after 2000 cycles ]](2d_2coils_10A_25A_Ne_Te_040000.gif)
Fig. 15 電子密度( Ne )及び 電子温度 ( Te ) [ 2000周期後 ]
Ne のピークは装置中央部となり,Ne の絶対値もほぼピークとなります.
![transient : Ne and Te ( after 5000 cycles ]](2d_2coils_10A_25A_Ne_Te_100000.gif)
Ne のピーク値が少しずつ下がって行きます.
Fig. 16 電子密度( Ne )及び 電子温度 ( Te ) [ 5000周期後 ]
![transient : Ne and Te ( after 10000 cycles ]](2d_2coils_10A_25A_Ne_Te_200000.gif)
Fig. 17 電子密度( Ne )及び 電子温度 ( Te ) [ 10000周期後 ]
Ne のピークは更に下がり,定常計算の結果へと近づいて行きます.定常計算の結果は,収束した状況しか示していませんが,非定常計算の結果と同様に一度 Ne が高くなっています.コイル電流一定として計算する場合,定常・非定常に関わらず,Ne が一旦大きくなってから落ち着く傾向を示すことが分かりました.
以下に,アニメーションの結果を幾つか示します.なお,示した物理量はピーク値で固定しています.
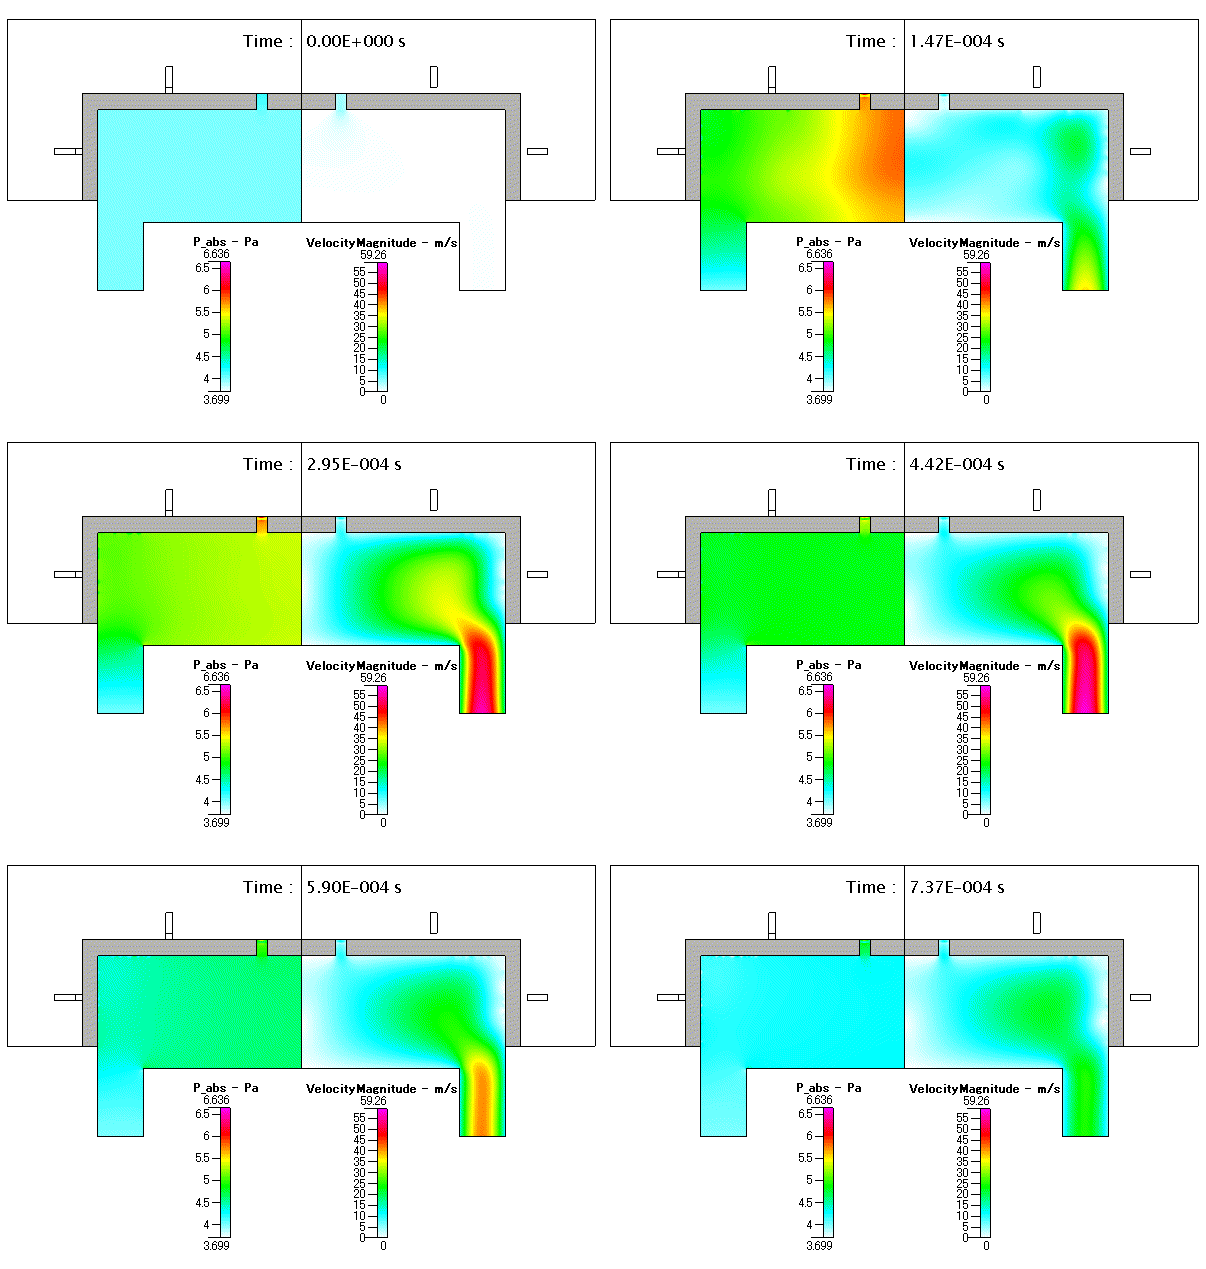
Fig. 18 圧力( absolute pressure )及び 流速( velocity mangnitude )
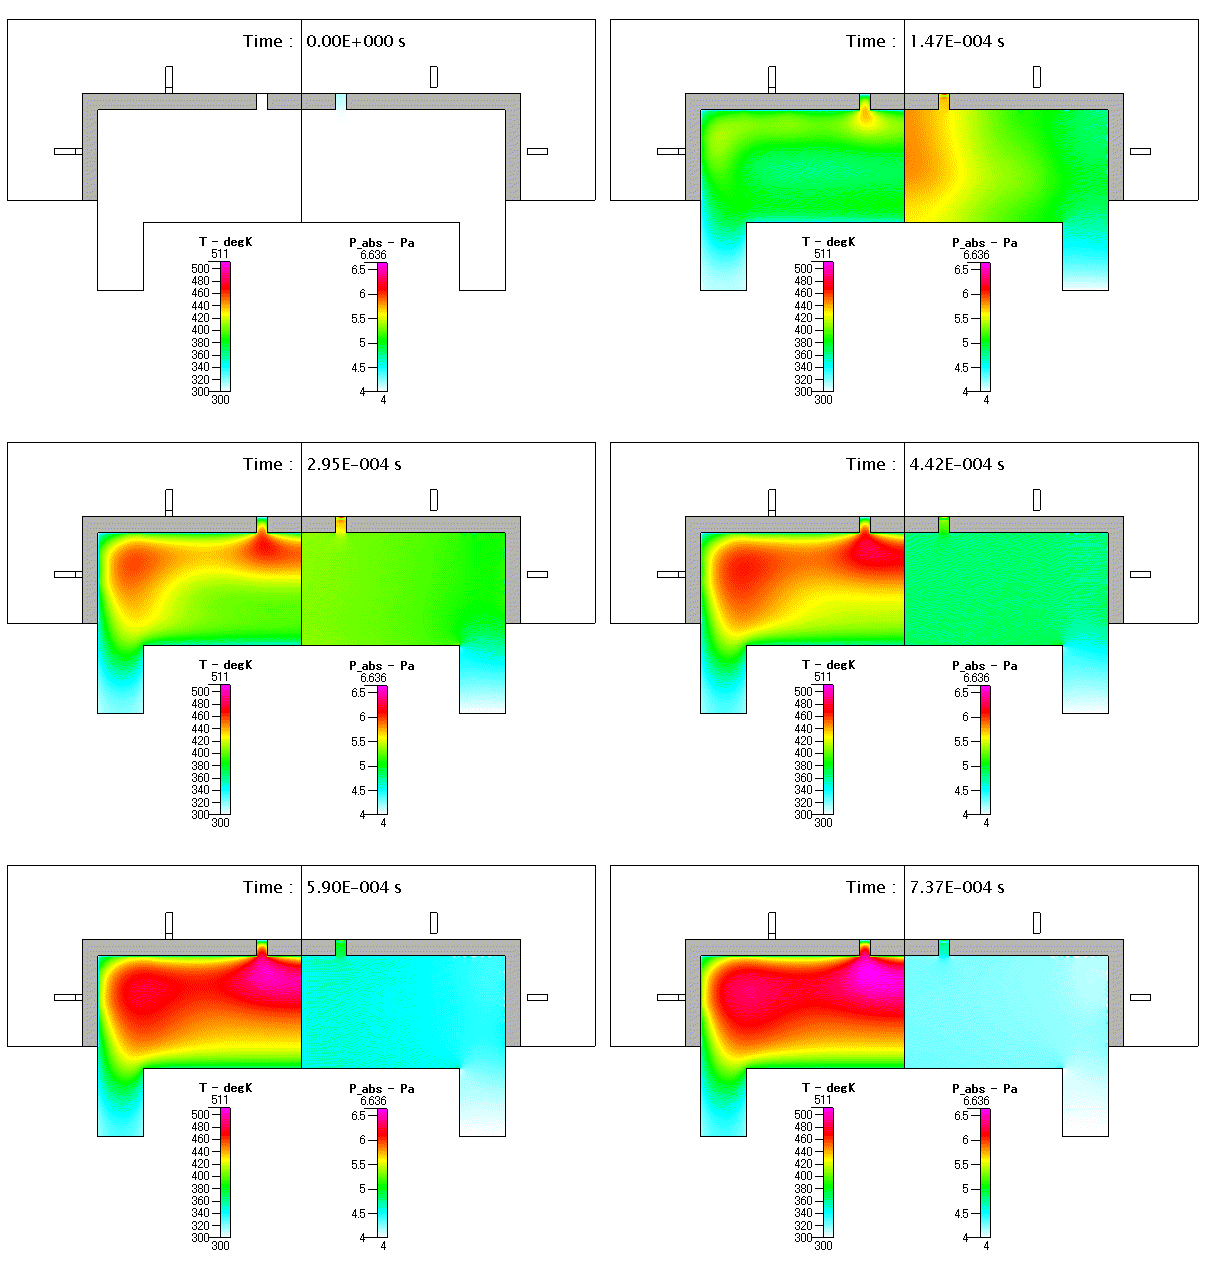
Fig. 19 ガス温度( gas temperature )及び 圧力( absolute pressure )

Fig. 20 ガス温度( gas temperature )及び 流速( velocity mangnitude )
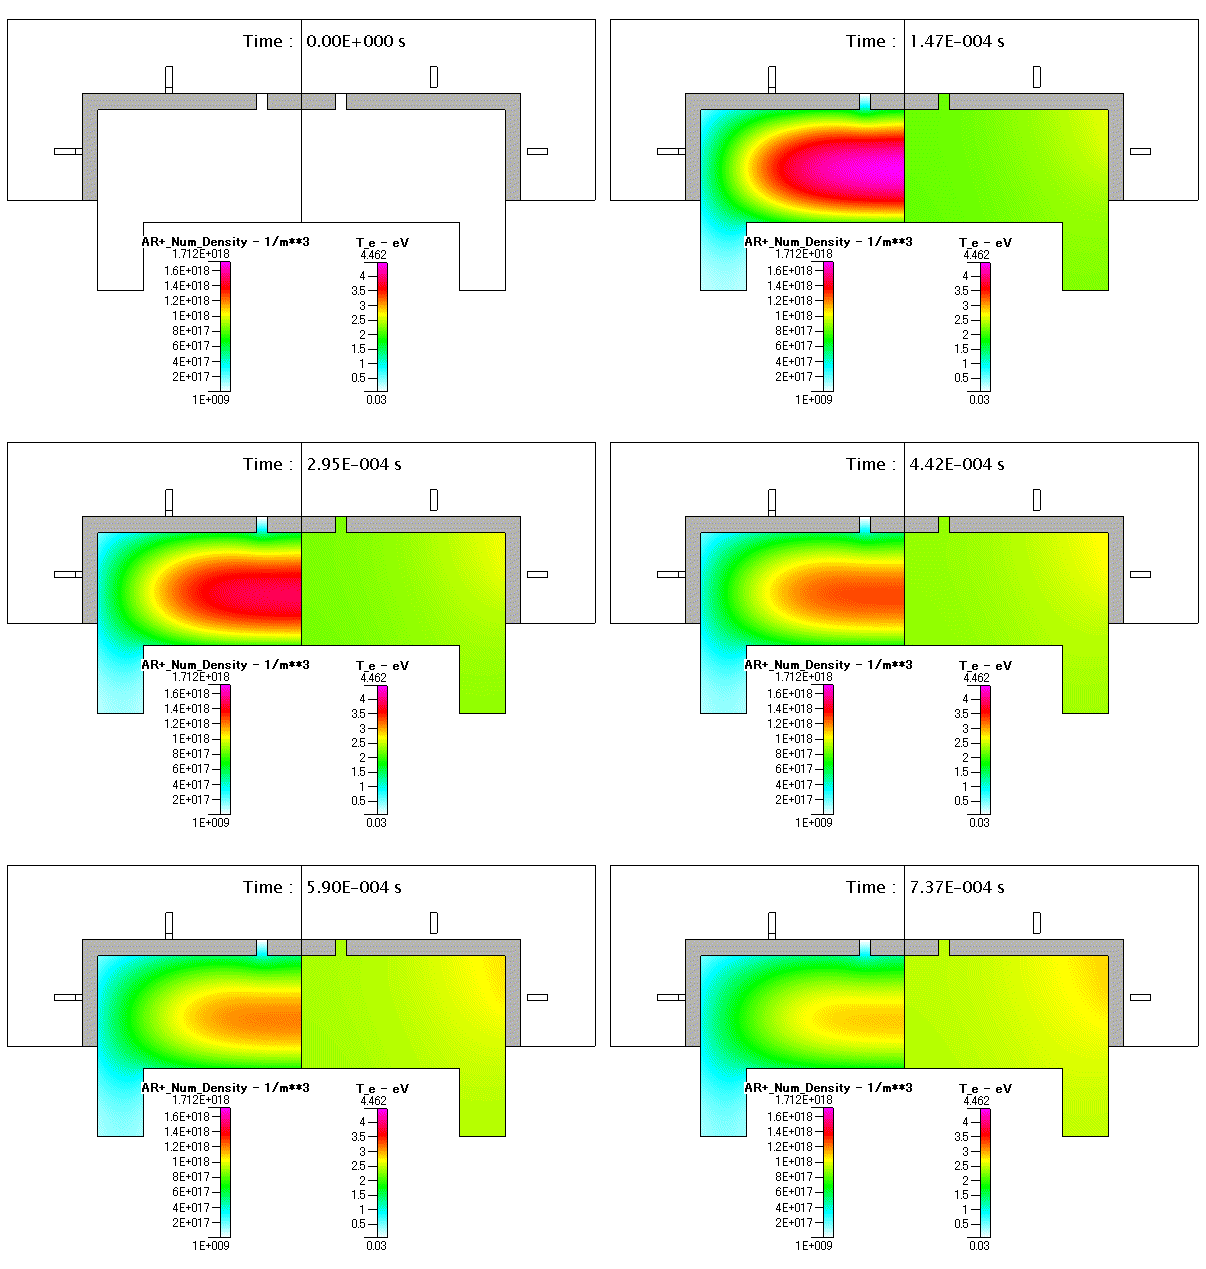
Fig. 21 Ar+( absolute pressure )及び 電子温度( Te )
☆
プラズマとガス流れを同時に解くには注意すべき点が多々ありますが,今回,CFD-ACE+ を用いて解析できることを確認できました.
今後,このモデルを利用し,CCP mode での計算についても検討を予定しています.
☆
back to home > products > CFD-ACE+
© 2008- ATHENASYS Co., Ltd. All Rights Reserved.
