
Looking at the news about coronavirus these days, many people may be wondering, 'Are masks really useful?' Governments and the media have been unable to explain exactly how corona virus can diffuse so rapidly.
In my research on the viruses with some papers and web sites, I realized that some questions can be qualitatively explained by considering the size of aerosol particles and the number and life span of the virus. Of course, more simulations and more accurate modeling verification are necessary, but I believe understanding transport mechanisms in consideration of physical phenomena is indispensable for understanding the mechanism of the virus infection.
This time, a fine grid is generated near the surface of the body for CAD data in the shape of a person using CFD-VisCART (cited [1]), and the flow and heat of CFD-ACE + are generated. ), Turbulence (turbulence), and Chemistry (chemical species / reaction) were used to calculate the transport of air in a room in winter and water vapor exhaled by breathing through the nose. Furthermore, using the results, Spray (diameter of 5, 20, 80, and 320 μm, starting from the smallest particle) is assumed to be transported assuming aerosol particles floating near the human face. Spray) module added and calculated.
The conclusion is that particles smaller than 20 μm are carried along with airflow, particles of 320 μm fall immediately, whereas particles of 80 μm fall and are carried in the airflow. There is an interesting result that most of the particles that adhere to humans have the largest size of 80 μm. Below is the introduction of the simulation conditions.
An overview of the grid used for the simulation is shown in Fig. 1 (animation).
Fig. 1 Computational grid
The simulation area was 500 mm rearward, 2000 mm forward, 1500 mm each side, and 2500 mm high from the foot, with the origin at the foot of the person.
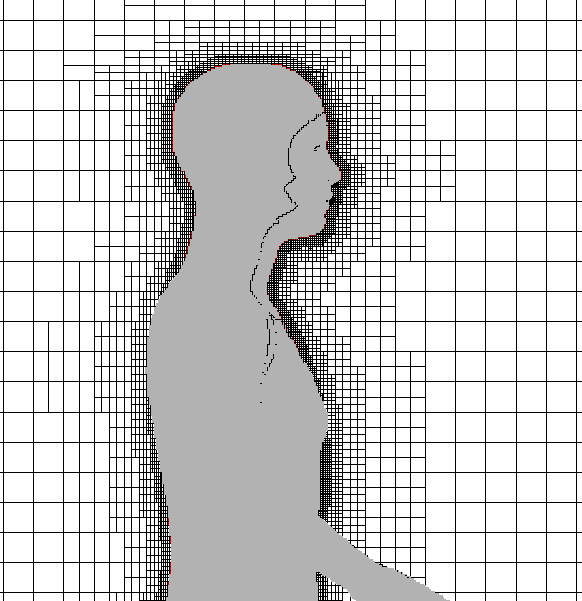
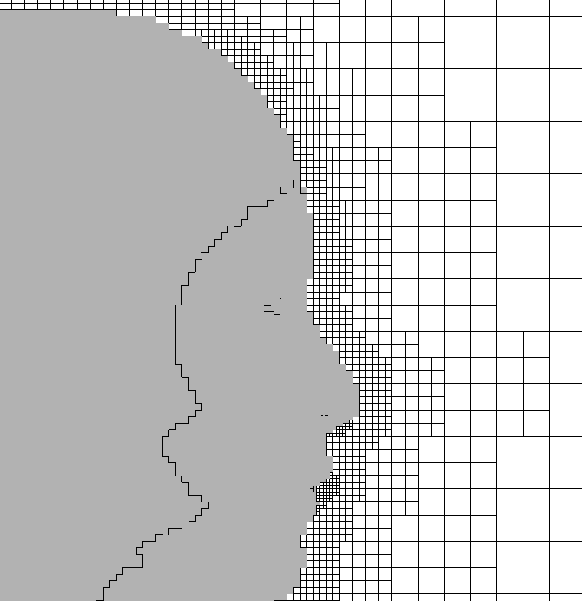
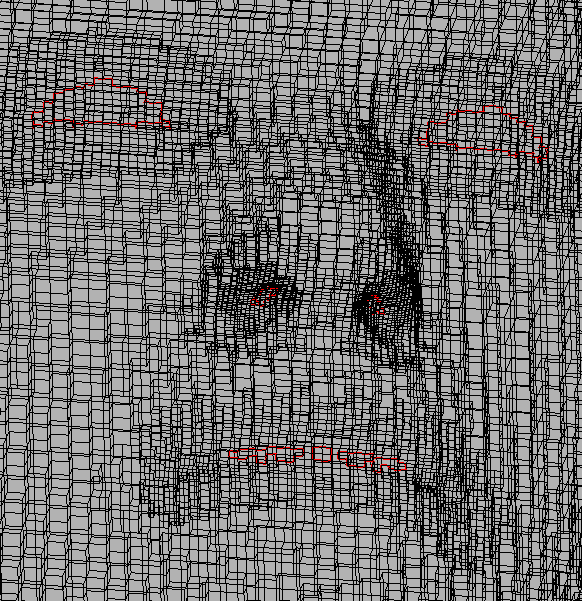
Fig. 2 Computational grid (partially enlarged)
The experimental simulation conditions for this time are as follows.
|
Room temperature: 10 ℃ Non-nose surface temperature: 20 ℃ The temperature of the nose and the air (N2/O2/H2O) coming out of the nose: 35 ℃ Room air composition (mass fraction): N2/O2 = 0.89/0.21 Composition of gas exhaled through the nose in one breath: 500 cc of N2/O2 + 0.1 g of water vapor |
In this simulation model, it is assumed that a 500 cc breath is exhaled once every 4 seconds based on NHK's web (cited from [2]). The amount of water vapor is estimated assuming that it is about half of the amount of saturated water vapor that can exist in 500 cc of air.
As a simple model, it is assumed that the time variation of the amount of breathing and inhalation during a breath follows a sine curve. Exhaust 500 cc of air + water vapor in one half cycle, and suck in equal mass air in the next half cycle.
Evaporation and condensation of suspended particles are omitted in this model.
Fig. 3 shows the change in the molar fraction of water vapor exhaled from the nose (20 seconds: 5 breaths) (the maximum value is fixed at 0.01, and the parts above 0.01 are also displayed in red)
Fig. 3 Changes in water vapor (molar fraction) exhaled by breathing (5 breaths, 20 seconds)
It can be seen that when the room air is cold, buoyancy causes an updraft around the body and warm water vapor also drifts near the ceiling.
☆
Next, using the above results as new initial conditions, we simulated a random arrangement of 100, 5, 20, 80, and 320 μm diameters near a human face, moving for 20 seconds. The particle density and thermal conductivity are similar to water. Particles that touched the floor, walls, and human body were required to adhere to those locations.
First, the trajectory of all particles is shown in different colors. The color changes from blue to red for 0 to 20 seconds. You can see that some fall down and others are carried to the top of the person.
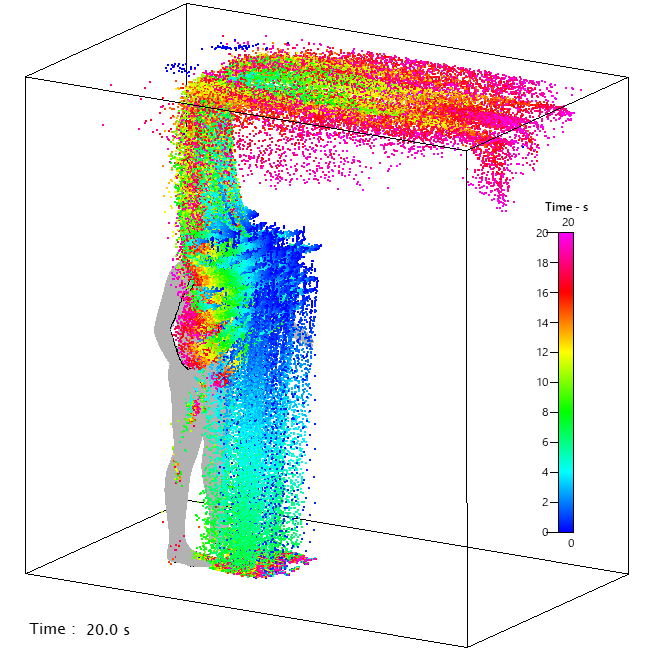
Fig. 4 Trajectory of all particles (0 to 20 seconds)
The figure below shows the results for each particle size.
It can be seen that the 320 μm particles immediately fall under the influence of gravity.
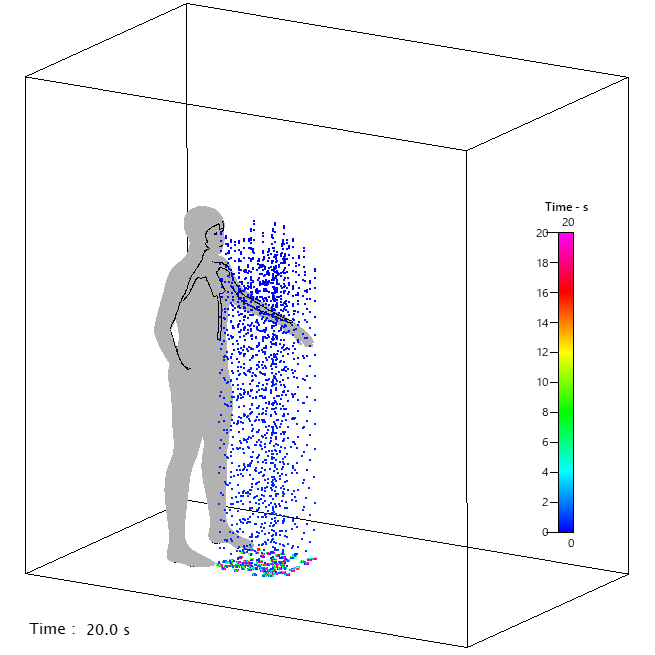
Fig. 5 Particle trajectory: 320 μm particle
Most 80 μm particles that fall away from the face fall off under the influence of gravity, but they move along with the airflow around the body, and there are quite a few that collide with or adhere to the body.
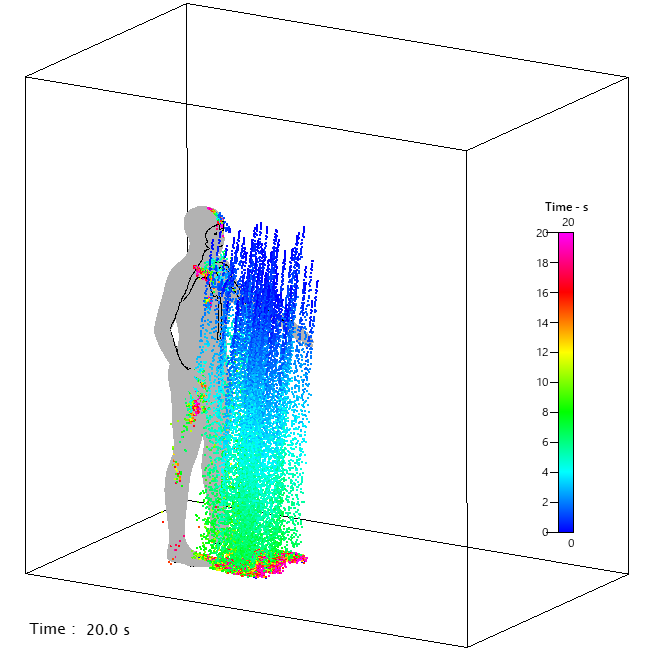
Fig. 6 Particle locus: 80 μm particle trajectory
The particles of 20 μm gradually fall under the influence of gravity while the flow is slow, but it can be seen that they are transported to the ceiling by the rising airflow due to buoyancy.
The particles of 20 μm gradually fall under the influence of gravity while the flow is slow, but it can be seen that they are transported to the ceiling by the rising airflow due to buoyancy.
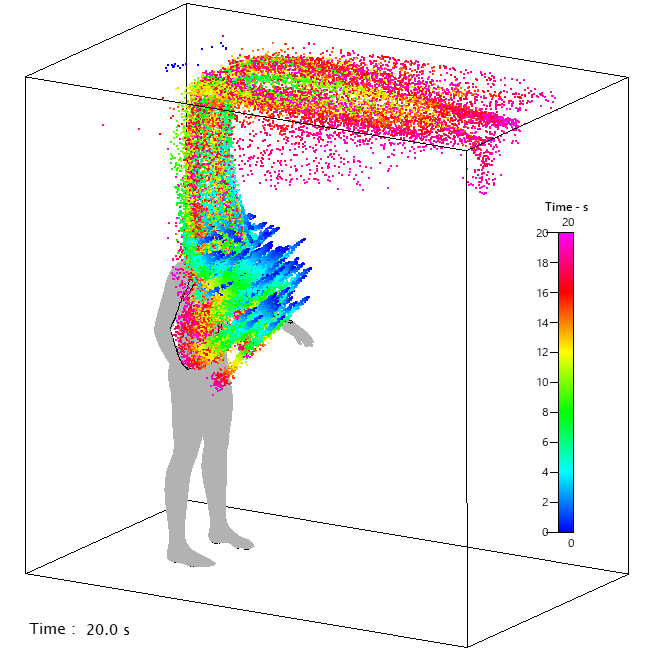
Fig. 7 Particle size: 20 μm particle trajectory
It can be seen that the 5 μm particles are more easily transported to the ceiling near the ceiling by the updraft due to the weaker effect of gravity.
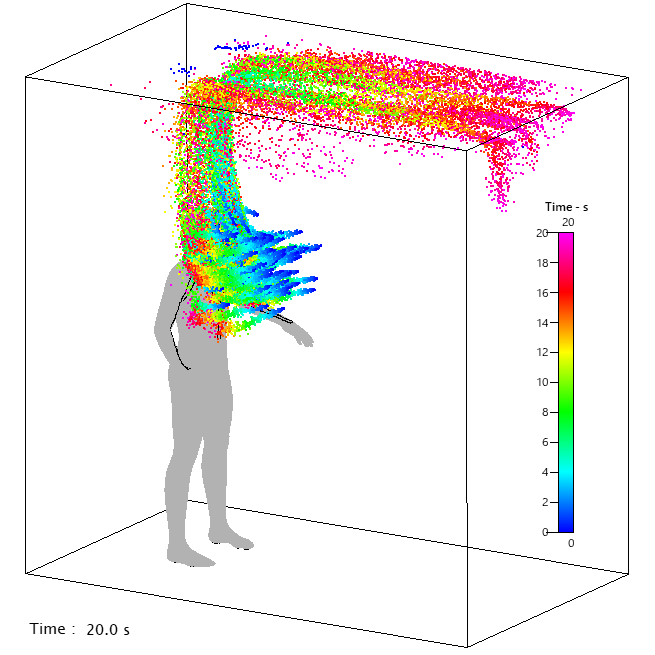
Fig. 8 Particle size: 5 μm particle trajectory
What about the size and location of the particles that adhere to places? Fig. 9 shows only the attached particles. Although some particles adhered slightly on the nose, it was found that particles with a particle size of 80 μm adhered to the head and chest in relatively large numbers. Heavy particles were found to adhere to the bottom, and some of the lighter particles adhered to the ceiling.
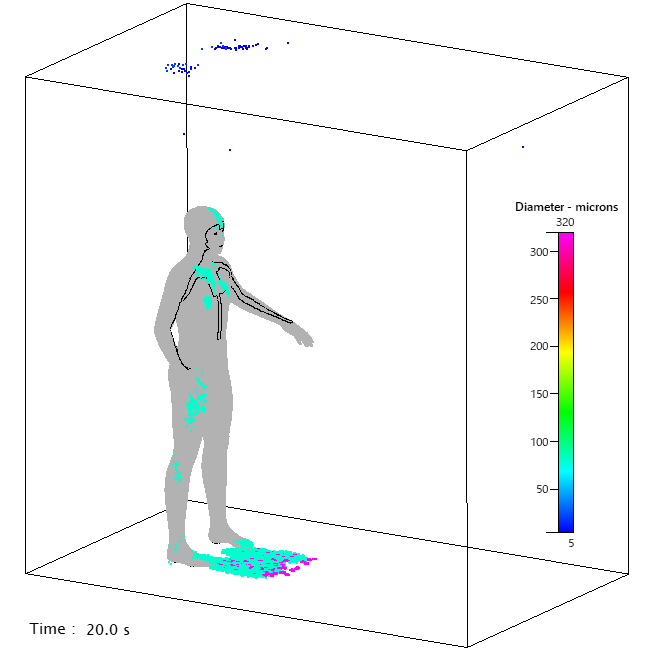
Fig. 9 Particles adhering to floor, wall, and body
The reason for the adhesion above the head or around the chest can be understood by considering the velocity distribution. If the updraft caused by buoyancy occurs not only on the face but also on the back of the head, it will be a place where the flow is stagnant above the head. The 80 μm particles do not stay in the updraft and land overhead due to the effect of gravity. Also in the chest, the flow slows down, and in areas where there is some flow toward the person, particles that have not entered the updraft will land on the body slowly.
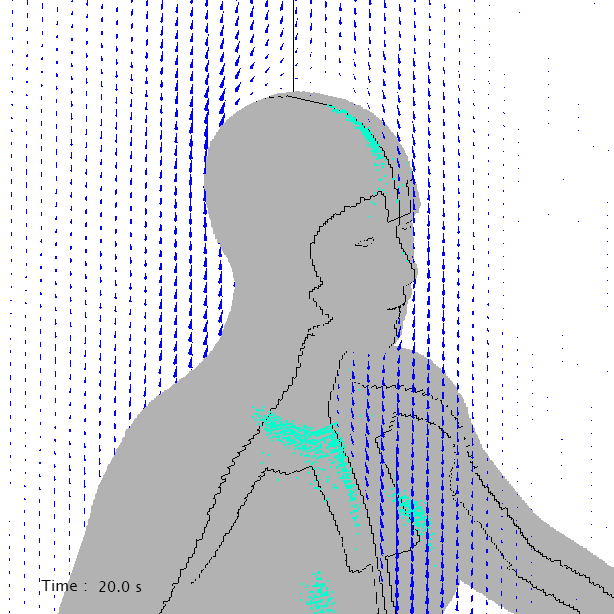
Fig. 10 Velocity vector near the face and attached particles
This time, it is assumed that the room temperature is low, but in this case, the updraft due to buoyancy was not negligible. Assuming a room that does not use an air conditioner in winter, small aerosol particles are expected to float in the upper part of the room for a long time. On the other hand, in summer, buoyancy is hardly affected, so updrafts are unlikely to occur, and forced flows such as air conditioners are expected to dominate.
Regarding the effect of humidity, Weather News (cited from [4]) quotes a paper and presents a graph indicating that when the humidity is high, the life span of the virus is short. The paper cited is a paper published by Harper et al. In 1961 in a journal of the US National Library of Medicine National Institutes of Health (cited [3]) did not explain the exact reason why it was short.
A paper published in The Journal of Infectious Diseases in 2018 (reference [5]) states that it is retained in aerosols and droplets regardless of relative humidity. From these papers, it seems that the relationship between virus life and humidity is still not well understood. This is probably because individual experimental environments and real environments are not comparing the same playing field.
Considering the results of this simulation and the fact that the particle size of aerosol particles changes, it can be explained that the 'apparent' life of the virus is short in a humid environment. In other words, aerosol particles under a lower saturated vapor pressure will be small in winter (or in a room that is dried by the effect of an air conditioner), and as a result, the time during which the particles are suspended in the air becomes longer. Conversely, when the humidity is high in humid summer or during the rainy season (in Japan), the saturated vapor pressure is high and the particle size tends to be large, so that it is expected that the floating time in the room will be short.
Infections are also spreading in hot and humid countries in the tropics, but this is understandable given that the infection would spread mainly in air-conditioned environments (in rooms where people live, etc.). It would be also natural to think that the rapid spread in Europe was not due to splash contact, but rather via small aerosol particles. Possivilitiy of the infection by aerosol particles is reported (cited [6] [7]).
The face mask can be expected to be really effective against virus, for example by a group at Hong Kong University (This link was added on April 4th, 2020). Even more than 5 μm partciles can spread from the gap between the mask and the face, so it is important to make the gap as small as possible. Particles of 1 μm or less (※ the size of coronavirus is even smaller, 0.1 μm) are dominated by Brownian motion and can hardly be expected to fall by gravity. Therefore, as long as the virus is alive, it will be floating in the room with the aerosol particles.
In addition, about the usefulness and precautions of the mask, I hope that you can also refer to"The opinion of the Japan Aerosol Society on mask wearing in new coronavirus and hay fever."(in Japanese though). The extent to which aerosol particles pass through and are captured by the mask will be considered separately in a simulation.
Particles are invisible, and anxiety cannot be completely eliminated, but as a familiar example, it would be easier to understand a person with smoking. When you pass a walking such a guy, he smells tobacco after passing by the walking person. Have you ever thought of it? Diffusion of fine particles is similar to the spread of smoke from cigarette smokers. If you don't have the wind, you would not smell the cigarettes before you pass by, but once you passed, you may be worried about the smell for a few seconds. (I often hold my breath for a few seconds when I pass a person who is walking). Also, in a smoke-free cafe where even one smoker is present, some people may be worried about the smell of cigarettes even if they are a little away, but the virus can also drift in the room. So you can understand that the 2 m distance, for example, is not very meaningful. In other words, there is a possibility of infection even at 5 m, and almost no possibility even at 1 m sometimes. It is necessary to deal with the situation at that time (including upwind / leeward, time spent in the room, etc.) is.
It is of course impossible to conclude the actual life time of the virus from the fluid dynamics, but for the above reasons, considering the saturated vapor pressure in air, the particle size of aerosol particles (and change over time), and the residence time, the cluster can be reasonably explained. It is also clear that ventilation is really important as an infection control measure. In winter, when the room temperature is low and the room is dry, increasing the saturation of water vapor in the room using a humidifier may reduce the proportion of suspended aerosol particles (* It is expected to greatly depend on the environment, and it is necessary to confirm by simulation close to the actual situation, and we can not guarantee it, but simulation will make it easier to take countermeasures.) In addition, if this study is qualitatively correct, it is expected that the incidence of infected people will be extremely low in many places in Japan during the rainy season.
Regarding the trajectory for droplet infection, we investigated various simulation conditions and found that the example published in 2013 by the Chinese research group at the Journal of The Royal Society Interface (reference [8]) could be helpful. It has been investigated that there are two types of particle size distribution, and I would like to prepare and examine a simulation model.
Postscript 1 (2020/03/20)
According to Ref. [9], which examined pollen invading the house, the particle size distribution of cedar pollen in the air was a bimodal type with peaks of 25 μm or more and 5 μm both indoors and outdoors, especially the amount of allergen measured indoors. According to the result, the peak at 5 μm is remarkable. During the hay fever season, aerosol particles with a particle size of 5 μm or more float in the room, and it is possible that the virus adheres and floats. If the floor is flooring, cleaning the floor by wiping it with water will reduce the possibility of rolling up aerosol particles that have fallen on the floor, even in an environment using an air conditioner. It is similar to hay fever measures, but I think that it is better to increase the chance of floor cleaning (wiping if possible).
Postscript 2 (2020/04/02)
It is pointed out that the reason for the rapid expansion in Europe and the United States would be what BCG vaccination is prescribed (or nothing)
Another possible reason, from a point of view of transport phenomena, may be due to many old buildings made of stone and brick. There are many wooden houses in Japan, and most houses are less than several 10 years old. In the case of wooden houses, they are more susceptible to the outside temperature than stones, and when the outside is warm, the inside of the houses tends to get warm immediately. On the other hand, in the case of stone houses/buildings, it is expected that in winter, if there is no heating, a very cold environment will continue for a long period of time, and the situation simulated this time will likely last for a long time. In addition, in the case of old houses/buildings in Europe and the United States, there are many places with insufficient ventilation (a search finds many articles that Italian apartments are often mouldy). In such a situation, for example, if there is an infected person on the first floor, the air in the updraft would spread to the second floor or higher floors, and the infection would spread in the building even if they do not meet face-to-face.
[1] Human CAD Data I used the data of is GrabCAD
[2] ヒトが呼吸する空気の量...(in Japanese)
[3] Airborne micro-organisms: survival tests with four viruses...J. Hyg., Camb. (1961), 59, 479
[4] インフルエンザウイルスの寿命は湿度で決まる...(in Japanese)
[5] Influenza Virus Infectivity Is Retained in Aerosols and Droplets Independent of Relative Humidity...The Journal of Infectious Diseases
[6] 新型コロナで可能性指摘 「エアロゾル感染」とは? ...(in Japanese)
[7] 「エアロゾル感染」可能性認める 中国政府 新型肺炎 「飛沫」より感染力 ...(in Japanese)
[8] Characterizations of particle size distribution of the droplets exhaled by Sneeze...Journal of The Royal Society Interface
[9] 住居内侵入スギ花粉エアロゾルに関する研究 : 粒径分布・換気量・落下構造...(in Japanese)
新型コロナ「エアロゾル」で3時間生存 米研究グループが発表 ...(in Japanese)
コロナ、空気中に最大3時間残存 米チーム、微粒子状で感染力保持...(in Japanese)
New coronavirus stable for hours on surfaces
March 16, 2020: The first upload。
March 18, 2020: Addition - The effects of masks and humidifiers
March 22, 2020: Addition - Possible causes of the rapid spread of infection in Europe and the United States.
☆
back to home > products > CFD-ACE+
© 2008- ATHENASYS Co., Ltd. All Rights Reserved.